nu-SSVM
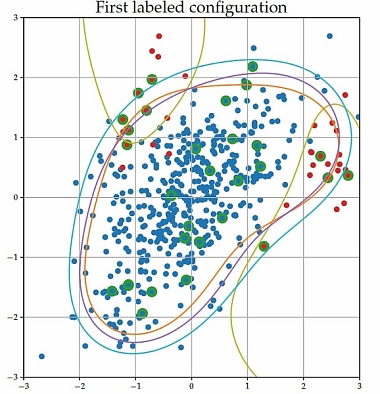
This jupyter notebook allow to illustrate the algorithm ν-SSVM introduced in the linked paper for two different configurations of partial labelling, and to retrieve the corresponding figures.

Generalized frequency estimator
A frequency estimator with closed-form combination of three Discrete Fourier Transform (DFT) samples is proposed. The method is compatible with zero padding and tapered data within the class of cosine windowing.

Extract the legend of a MATLAB figure
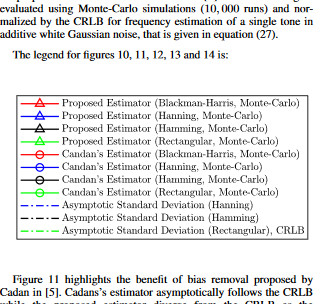
This script extracts the legend from a MATLAB figure. For example, if an important legend corresponds to several figures, this script makes it possible to isolate it in order to export it to make it appear next to the figures in a document.
This script extracts the legend from a MATLAB figure.

LaTeX Plot
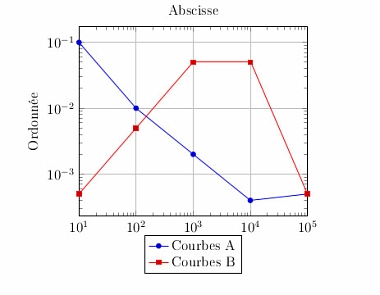
The TéSA LaTeX Plot MATLAB library provides a set of functions that generates latex code in order to display simple plots or multiple plots with the same X axis.
Produces latex code in order to display MATLAB figures.

Altimetry: estimation of the Sea Level Anomaly (SLA) slope
TéSA is working on the estimation of Sea Level Anomaly (SLA) signal characteristics in collaboration with the CNES (French Space Agency), with a particular focus on slope spectral estimation. A new method called "ARWARP", combining frequency warping, autoregressive modeling and linear regression has been presented in IGARSS 2020, showning interesting performance, compared to the usual method based on the periodogram.
Matlab software of IGARSS 2020 paper for SLA slope estimation using ARWARP method
SLA slope estimation using ARWARP method and 2 different ways of fitting the slope, with Cramér-Rao boundMatlab software of IEEE Trans on Geoscience and Remote Sensing paper (under revision) for SLA slope estimation using ARWARP method, with two different methods for fitting the spectral slope and with the Cramér-Rao bound computation.

P and T wave detection and estimation in ECG signals
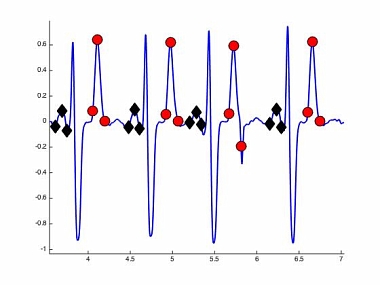
TéSA has brought his statistical signal processing expertise in electrocardiogram (ECG) processing, through the PhD of Chao Lin (July 2012). In order to help diagnosis, it is of interest to automatically analyze ECGs and to detect the different waveforms (P, QRS, T waves). Bayesian estimation/detection algorithms suitable for P and T wave analysis in ECG signals have been successfully proposed during the PhD. The freely available Matlab codes have been published in the IEEE Trans on Biomedical Engineering 2010 journal and at IEEE ICASSP 2011 conference.
Matlab software for detection and estimation of P and T waves in ECG signals, corresponding to IEEE Tr Biomed Eng. 2010 and ICASSP 2011 papers (please read the readme.txt)
ADDRESS
7 boulevard de la Gare
31500 Toulouse
France